
5 Drupal Website Performance Mistakes That Kill Speed in 2026: Free Audit at DrupalCon
Palak Agrawal
Published on March 10, 2026
10 min read
Share on:
"A slow Drupal website is rarely caused by outdated infrastructure alone. In most cases, Drupal website performance issues stem from misconfigured caching, inefficient database queries, and unoptimized frontend assets. These hidden mistakes not only impact Core Web Vitals but also affect user experience, search visibility, and conversions."
You invest heavily in your digital infrastructure, upgrade your servers, and keep your core software up to date. You expect a fast, responsive user experience. Yet, users complain about page load times, your bounce rate climbs, and Google Search Console constantly flags your site for poor Core Web Vitals.
Teams assume that simply moving to modern infrastructure automatically guarantees speed. In reality, modern Content Management Systems are highly susceptible to configuration errors.
A misconfigured system aggressively consumes server resources, penalizing your business with lost conversions and inflated cloud hosting bills. According to Google, when a site meets the Core Web Vitals threshold, users are 24% less likely to abandon page load.
The most common causes of a slow Drupal site include misconfigured caching layers, unoptimized Views-generated database queries, failing to aggregate front-end assets properly, and leaving development tools enabled in production environments.
If you are losing traffic and trying to figure out what went wrong, here is a technical breakdown of the performance mistakes costing you revenue and exactly how to fix them.
Why Is My Drupal Site So Slow?
When a client asks, “Why is my Drupal site so slow?” the first step is always to isolate the bottleneck. Slowness is a symptom, and we must trace it back to one of two distinct areas of your architecture: the backend or the frontend.
Backend slowness is measured by Time to First Byte (TTFB). This is the time it takes for a user's browser to send a request, your server to process the PHP, query the database, assemble the HTML, and send the first byte of data back.
High TTFB in Drupal 11 is almost always a server-side rendering delay caused by poor database queries, lack of server-level caching, or inadequate PHP configurations.
For instance, running Drupal 11 on PHP 8.3 offers incredible performance via its JIT (Just-In-Time) compiler, but if your OPcache memory limits (opcache.memory_consumption) are set too low, the server is forced to recompile PHP scripts continuously, killing your response times.
Frontend slowness, on the other hand, is a browser-side issue. Your server might deliver the HTML document in 200 milliseconds, but if the browser must parse massive, unoptimized images or block rendering to load megabytes of JavaScript, the user experiences a slow site.
Improving Drupal website performance requires understanding the root causes behind slow load times.
5 Drupal Mistakes That Kill Performance and Core Web Vitals
Optimizing Drupal core web vitals requires a systematic review of how your application handles data and assets. Here are the five most devastating performance mistakes site owners make and how they can be corrected:
1. Relying on Basic Caching Instead of a Multi-Layered Architecture
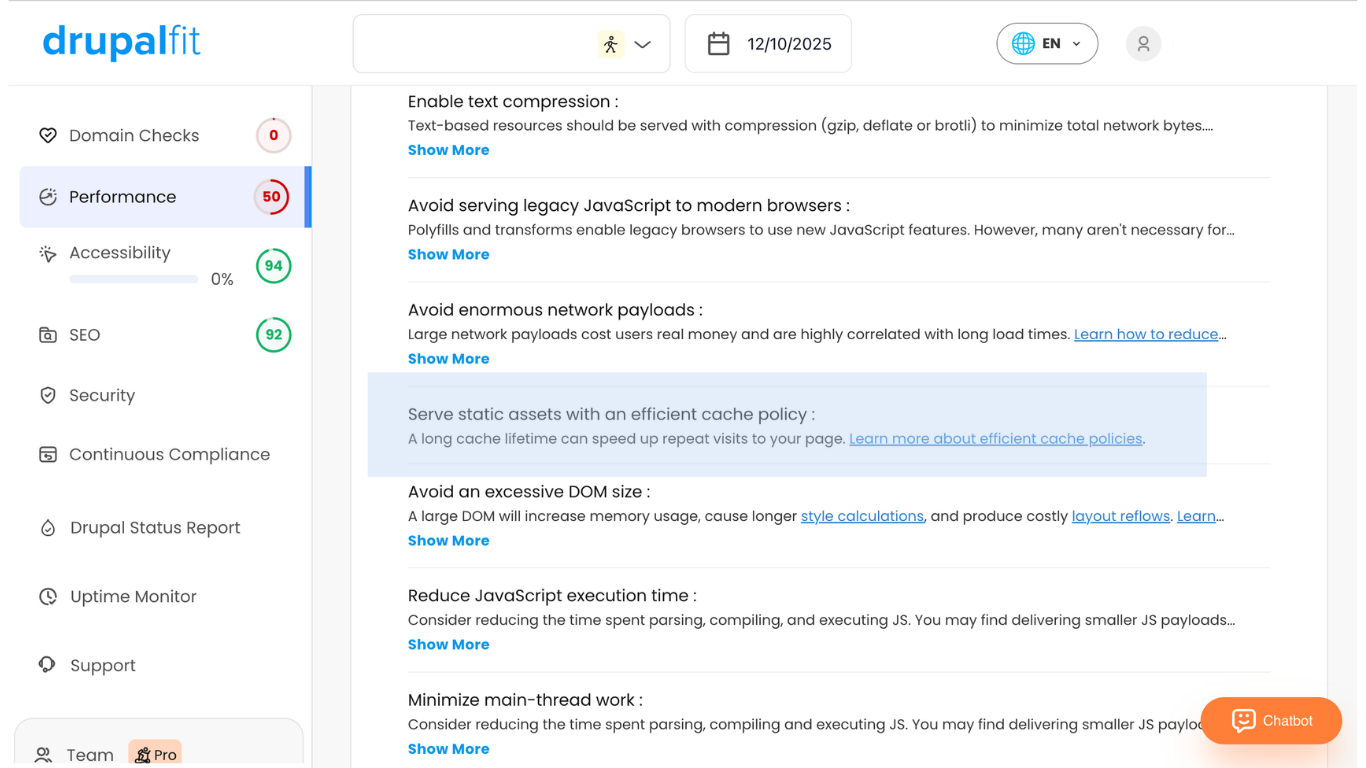
The caching system uses Cache Tags and Cache Contexts to serve dynamic content efficiently. However, relying solely on the Internal Page Cache is a massive mistake for any complex site.
The Internal Page Cache only works for anonymous traffic. Once a user logs in, adds an item to a cart, or triggers personalized content, they bypass this cache entirely.
Not utilizing external caching layers kills your TTFB. When an authenticated user bypasses the basic cache, the server must bootstrap the entire framework and run expensive database queries for every single click.
The Fix: You need a multi-layered caching architecture to protect your database.
- Varnish or CDN Edge Caching: Place Varnish (a reverse HTTP proxy) or a CDN like Cloudflare in front of your web server. A properly tuned Edge layer serves cached pages instantly before the request touches PHP.
- Granular Cache Invalidation: Set up granular cache invalidation rules using tools like the Purge module. Instead of clearing the entire cache for a minor content update, which spikes server load, you only invalidate the specific Cache Tags associated with the updated node.
- Edge Side Includes (ESI) and BigPipe: Use ESI or the core BigPipe module to fragment your caching. These tools send the cached, static parts of a web page to the browser immediately while the dynamic, personalized elements render in the background.
2. Neglecting Database Optimization and Indexing
If you run a high-traffic site, ignoring Drupal database optimization is one of the fastest ways to crash your server. Without proper tuning, complex database queries can easily take 8 to 12 seconds to execute during peak traffic.
Site builders often use the "Views" module to query the database and present content. Because the UI is user-friendly, developers frequently build Views with multiple relationships and complex sorting rules without considering the underlying SQL.
If the database tables lack proper indexes, the database engine executes a "full table scan," reading every single row to find the requested content.
The Fix:
- Add Missing Indexes: Work with a database administrator to analyze your slow query logs. Add custom indexes to your MySQL or PostgreSQL database for the specific fields your complex Views query most often.
- Implement Query Caching: Implement Redis or Memcached as an in-memory data store. This prevents the application from repeatedly asking the database for the exact same query results.
- Optimize Views Relationships: Audit your Views and strip out unnecessary relationships that create massive, inefficient SQL JOIN operations.
3. Serving Bloated Frontend Assets (Unoptimized JS/CSS)
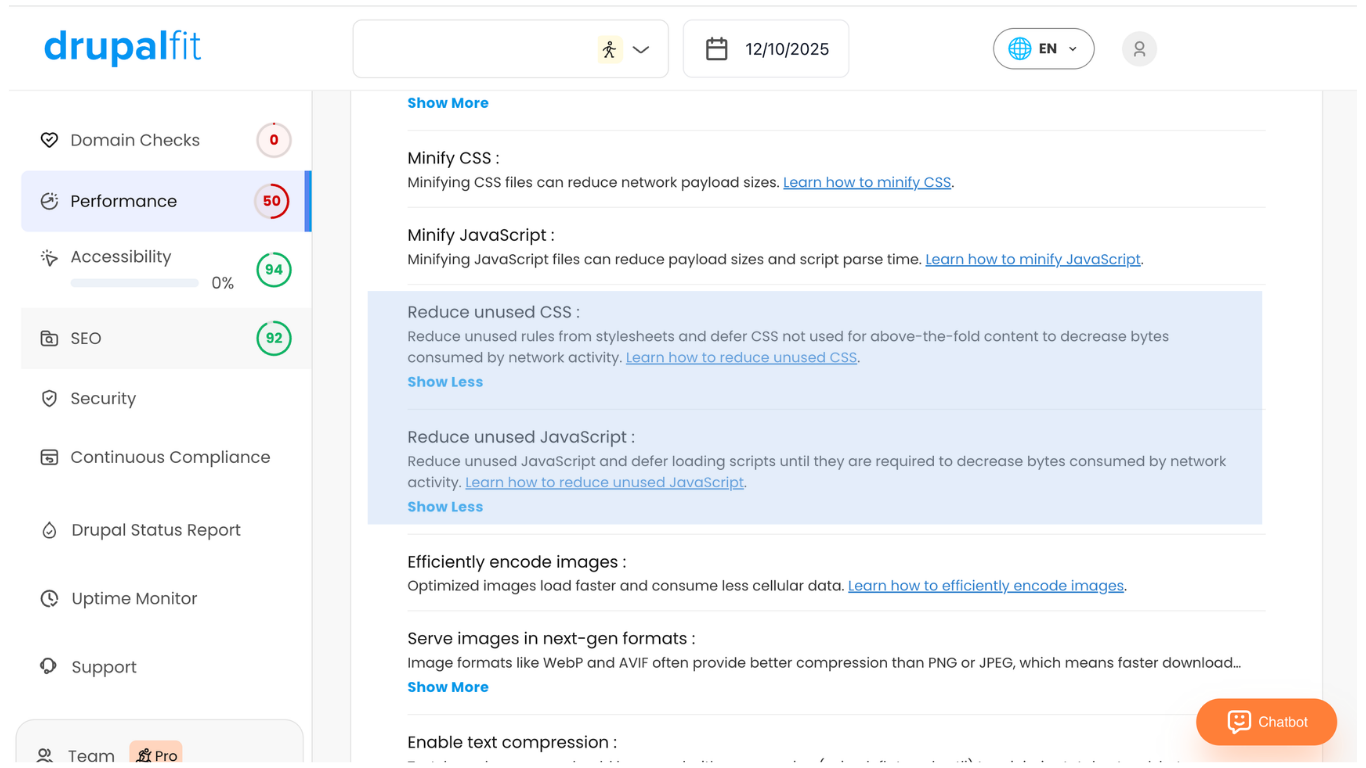
Even with a blazing-fast backend, serving dozens of heavy JavaScript and CSS files taxes the browser's main thread. According to the HTTP Archive's State of the Web report, the median page weight heavily relies on JavaScript, and parsing this code is the primary cause of frontend delays on mobile devices.
Failing to remove unused code, lazy-load scripts, or minimize render-blocking CSS directly ruins your First Contentful Paint (FCP) and Largest Contentful Paint (LCP) scores. If a mobile browser has to download, parse, and execute 40 separate CSS and JS files before it can render the page, your LCP will easily fail Google's 2.5-second threshold.
The Fix:
- Aggregate and Minify: Ensure core CSS and JavaScript aggregation is active. This combines multiple files into a single, minified payload.
- Critical CSS: Extract and inline your critical, above-the-fold CSS. This allows the browser to paint the visible portion of the website immediately while the rest of the stylesheet downloads in the background.
- Defer Non-Essential JavaScript: Use modules like Advanced CSS/JS Aggregation to implement asynchronous loading, deferring render-blocking scripts that the user does not immediately need.
4. Overlooking Server Resource Monitoring (Memory & CPU Leaks)
Many technical teams treat infrastructure as a "set it and forget it" environment. They fail to track basic metrics like Apache/Nginx worker status, PHP memory usage, or cache hit rates. This is the equivalent of flying blind.
CPU spikes and PHP memory leaks cripple performance.
If a poorly written custom module contains a memory leak, it will eventually consume all available PHP memory, causing fatal errors and site outages. If a CTO or lead developer does not actively monitor these metrics, they inevitably waste thousands of dollars scaling up server resources to compensate for bad code.
The Fix:
- Implement APM: Integrate tools like New Relic, Datadog, or Dynatrace into your server stack.
- Track Cache Hit Rates: Monitor your Varnish and Redis hit rates. If your cache hit rate drops below 80% on a standard content site, investigate immediately.
- Audit Custom Code: Regularly profile your custom modules using tools like Blackfire.io to identify exact functions causing CPU spikes or memory leaks.
5. Poor Media Handling and Unoptimized Images
Handling media poorly is a classic UI killer and the absolute easiest way to destroy your Core Web Vitals. The absence of automatic image optimization, responsive handling, and lazy loading forces users to download massive, un-transcoded media files.
Serving a 4MB, 4000-pixel-wide image to a user on a 400-pixel-wide mobile screen destroys performance and consumes unnecessary bandwidth.
The Fix:
- Responsive Image Styles: Configure core Responsive Image Styles to generate multiple sizes of the same image automatically. The browser then downloads only the file size appropriate for the user's screen width.
- Next-Gen Formats: Use modules like WebP or AVIF to serve modern image formats. These formats provide superior compression, reducing file sizes by up to 30% compared to traditional JPEGs or PNGs.
- Native Lazy Loading: Ensure native browser lazy loading (loading="lazy") is applied to all images below the fold, so the browser does not waste resources downloading images the user hasn't scrolled to yet.
How to do Website Performance Optimization?
You cannot fix what you do not measure. Instead of blindly guessing which pages are slow or where your infrastructure is bleeding resources, you need a clear, highly accurate baseline of your website’s overall health.
This is exactly where DrupalFit comes in.
DrupalFit is an automated, 360-degree website audit and monitoring SaaS platform. Rather than requiring your team to manually dig through complex code, server logs, or database queries, DrupalFit does the heavy lifting for you.
DrupalFit works as a specialized website performance analyzer tailored built specifically for the Drupal ecosystem
Here is how it simplifies the optimization process:
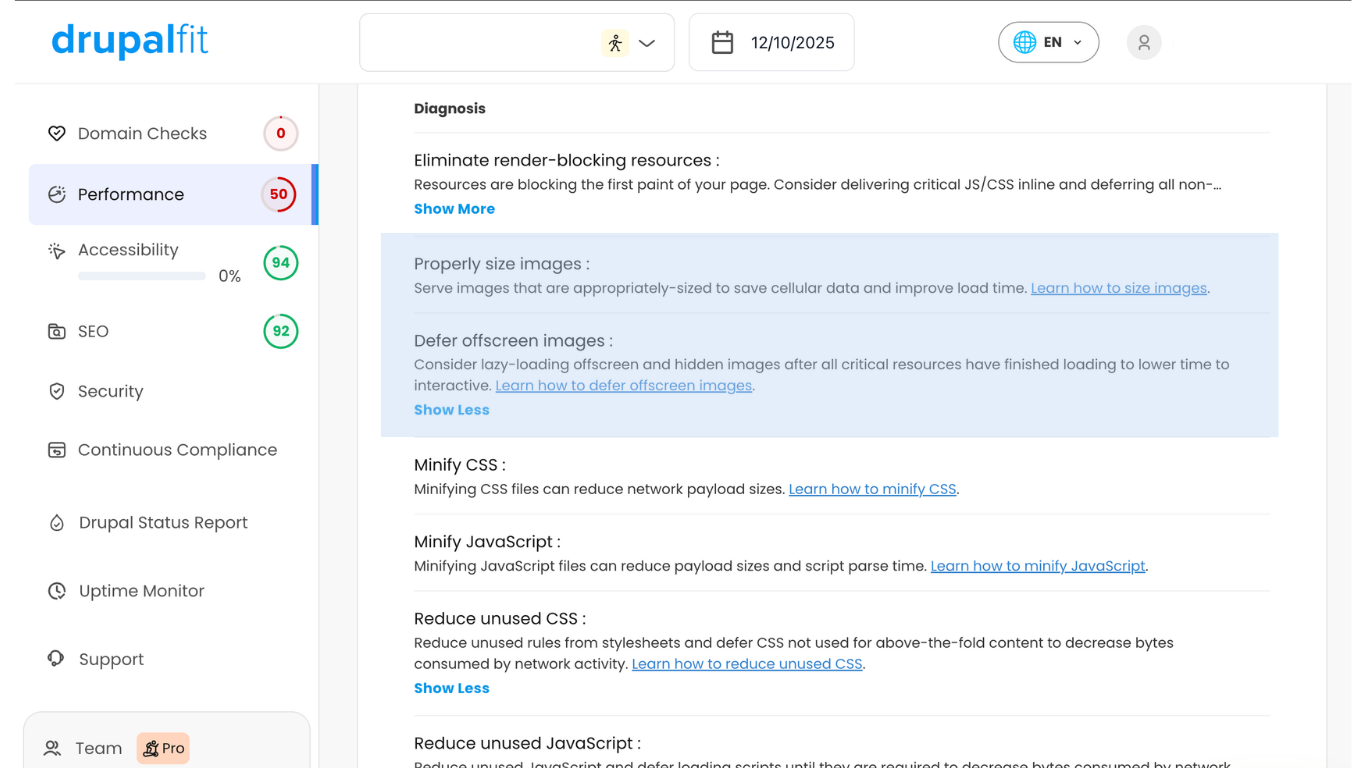
- Automated Performance Diagnostics: Its automated website performance check identifies what exactly is slowing your site down. It seamlessly connects to your Drupal site to identify bottlenecks, flagging heavy assets, slow load times, and the specific Core Web Vitals issues hurting your user experience.
- Holistic Health Checks: Speed does not exist in a vacuum. DrupalFit simultaneously audits your site for critical security vulnerabilities, SEO gaps, and WCAG accessibility compliance.
- Actionable Reporting: Instead of overwhelming you with raw, technical data, DrupalFit provides a centralized dashboard with prioritized, step-by-step recommendations. Your development team knows exactly what to fix first to achieve the highest impact.
- Continuous Monitoring: Optimization is an ongoing process. DrupalFit acts as your continuous health monitor, alerting you to new performance drops, outdated modules, or broken links before your users notice them.
By utilizing a specialized platform like DrupalFit, you take the guesswork out of website maintenance.
Prioritizing Drupal Website Performance Optimization
Drupal website performance is no longer optional. Google and other search engines now factor Core Web Vitals into search ranking. That means Drupal site owners must tune performance to improve SEO, user experience, and higher conversion rates.
Furthermore, optimizing your database and caching layers drastically reduces the CPU and RAM requirements of your hosting environment, lowering your monthly cloud infrastructure costs.
Drupal 11 is an enterprise-grade engine. By fixing these five common mistakes:
- optimizing your cache,
- disabling debug tools,
- tuning your database queries,
- aggregating assets, and
- streamlining your admin logging
By prioritizing Drupal website performance, you create a faster, more cost‑efficient, and more scalable platform.
Ready to stop guessing and start optimizing?
Run a comprehensive, automated audit of your site's codebase and server configurations at DrupalFit.
Get your free audit during DrupalCon Chicago and let us help you turn your Drupal 11 site into a high-performance asset by:
Enter the DrupalFit Challenge Now!